WMAR-2 News is going In Focus into how kids have been impacted by COVID-19.
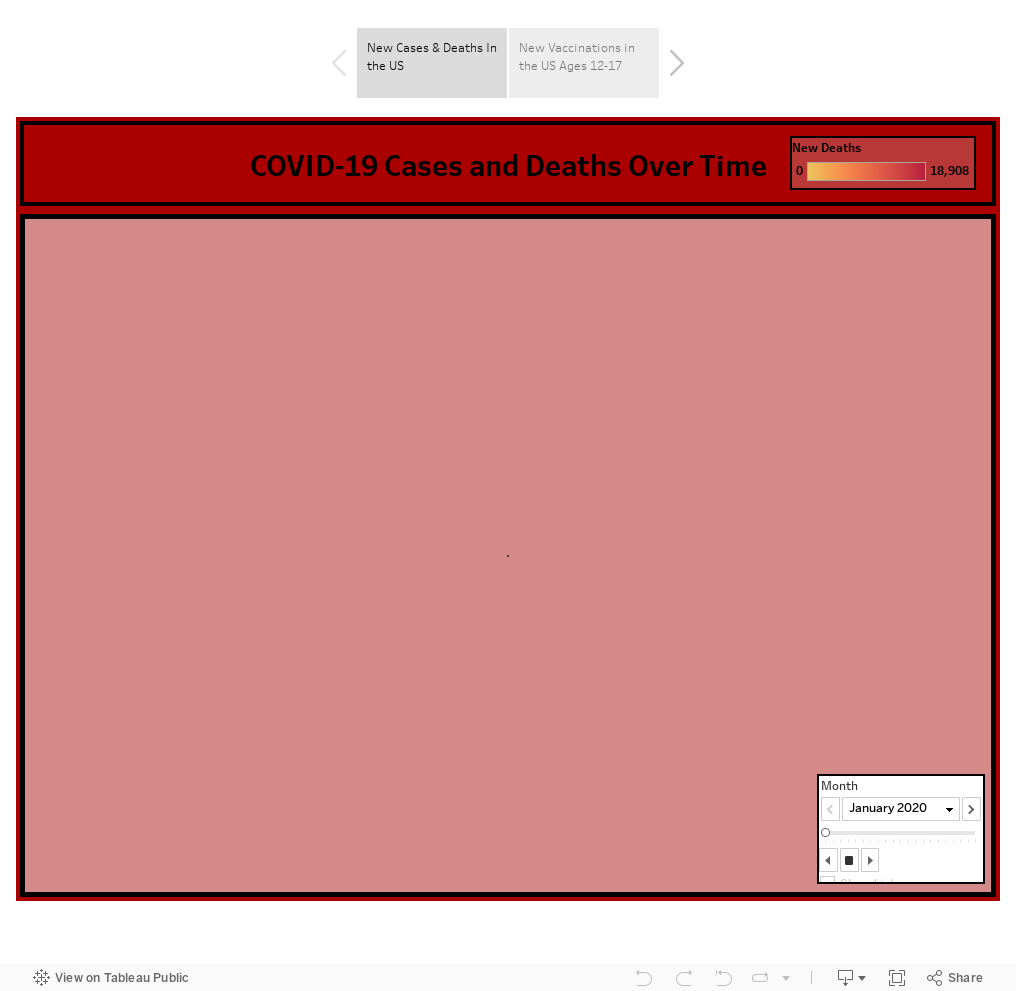
We can take a look at the increases and decreases in COVID-19 cases across the country over time, with the size of the circles corresponding to the case load and the color corresponding to new deaths per month.
RELATED: 8-year-old battles post-COVID syndrome
Press play to watch the case counts grow and shrink.
In the second tab, you'll be able to find how many teens across the country were vaccinated against COVID-19.
Data used in above visualization from the CDC.
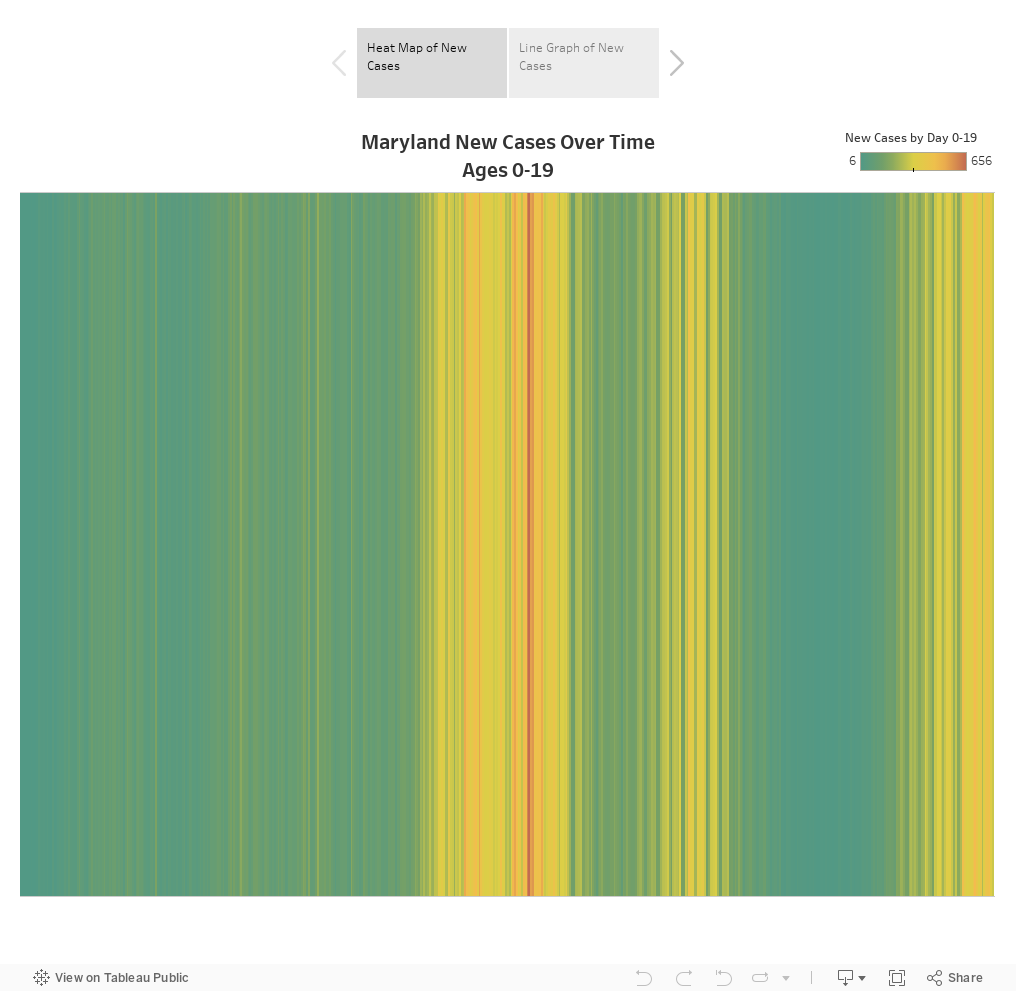
Zooming in to Maryland, we have a heat map of new cases each day for everyone ages 0-19 since the pandemic began.
On the second tab, you can see a breakdown between ages 0-9 and 10-19, also in Maryland.
Data in above visualization from Maryland.gov.